


03
2025 was marked by an improvement in the economic environment and a strengthening of global demand for oil and petroleum products.
Business Environment
Macro Landscape 1,2 and Petroleum Market 3,4
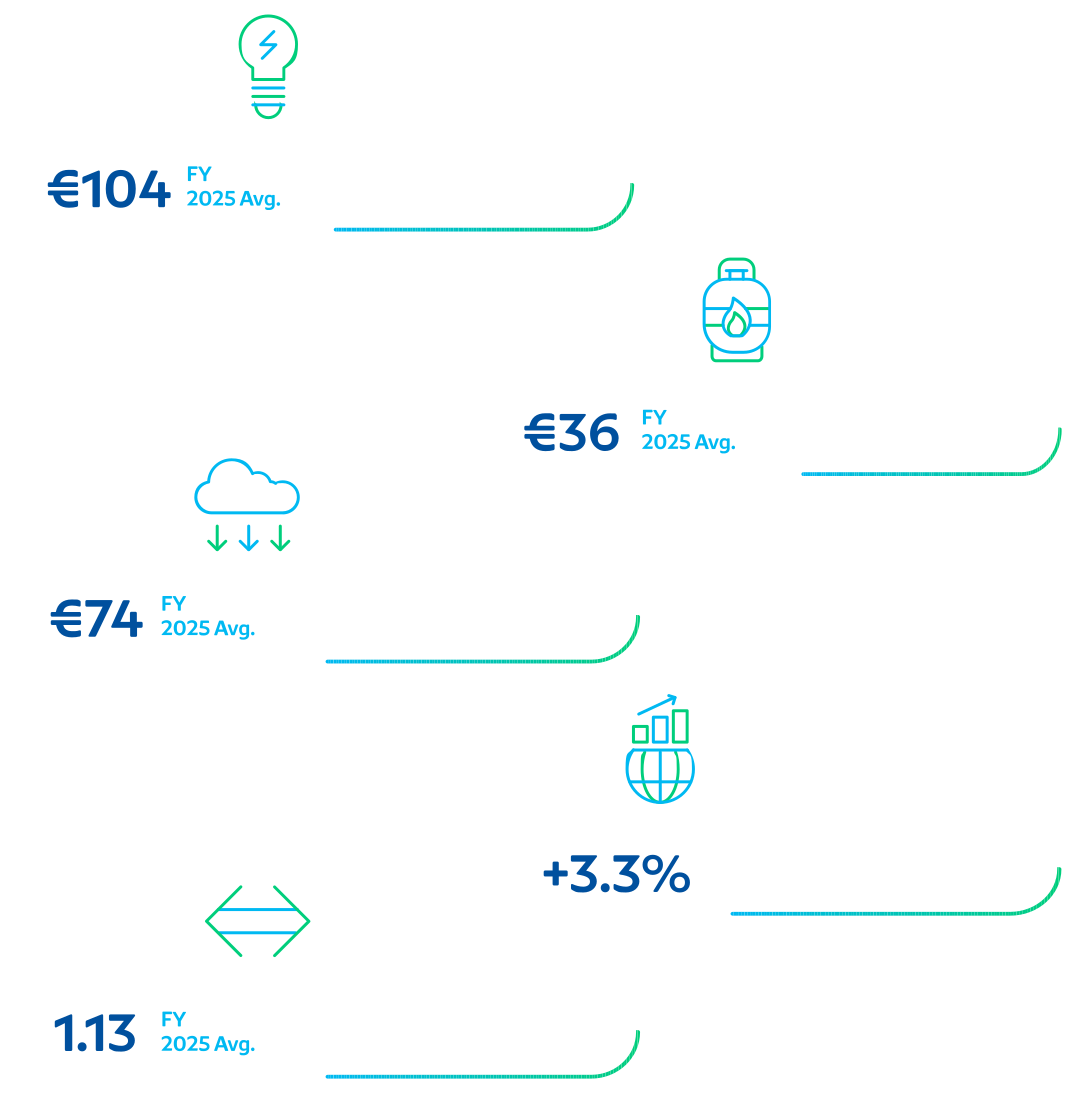
In 2025, the global economic environment experienced an expansion, driven by the combination of moderating inflationary pressures and declining energy prices, accommodative monetary policies, substantial investments in technology and AI, as well as robust fiscal expenditures in major economies. It is estimated that the global economy grew by 3.3% in 2025. Looking forward to 2026, it is anticipated that the persistence of the aforementioned growth drivers, coupled with the diminishing impact of restrictive trade policies, will support a similar annual economic growth rate.
In the advanced economies, Gross Domestic Product (GDP) is projected to have experienced an increase of 1.7% in 2025, following a 1.8% growth in 2024. In the emerging market and developing economies, the GDP is expected to have grown by 4.4% in 2025, consistent with the 4.3% growth recorded in 2024. Projections for 2026 indicate that economic growth will remain robust, with advanced economies and emerging market and developing economies anticipated to achieve growth rates of 1.7% and 4.4% respectively.
In the Euro Area, economic growth experienced moderate acceleration during 2025, with an estimated GDP increase of 1.4%, compared to the 0.9% growth rate recorded in 2024. The Euro Area economy has remained generally subdued due to the lingering effects of the post-Ukraine energy shock, which continued to weigh on manufacturing activity, while the appreciation of the Euro relative to other currencies has affected export competitiveness. The European Central Bank (ECB) implemented four reductions to benchmark deposit rates during 2025, resulting in a cumulative decrease of 100 basis points, with the objective of stimulating economic activity.
Economic growth in the Euro Area for 2026 is projected to reach 1.2%, supported by a combination of internal and external factors. Domestic demand is expected to strengthen, underpinned by rising real wages and improved financing conditions attributable to policy rate cuts initiated since 2024. Additionally, increased fiscal expenditures on infrastructure and defense are anticipated to further bolster growth. On the external front, despite persistent structural challenges, exports are expected to recover as uncertainties surrounding trade policy recede.
In the US, economic expansion was primarily driven by an increase in in technology-related investments, accommodative financial conditions and resilient private sector demand. The estimated economic growth for 2025 in the US is projected at 2.1%, with projections indicating an acceleration to 2.4% in 2026, supported by fiscal measures and a lower policy interest rate. Furthermore, the adverse effects of elevated trade barriers are expected to fade gradually, as bilateral tariffs are scheduled to be reduced until November 2026. At the same time, inflation pressures moderated during 2025; however, inflation remained relatively persistent due to pass‑through effects of tariffs and ongoing cost‑of‑living challenges. The inflation target of 2% is expected to be gradually reached within 2027.
In relation to emerging market economies, economic growth is expected to remain slightly above 4% in both 2026 and 2027, broadly stable compared with recent years, with China and India exhibiting even higher growth rates during this period.
In 2025, the EUR / USD rate strengthened significantly, rising from a low of 1.03 in January to close the year at 1.17, averaging $1.13. The movement was primarily driven by a) diverging monetary policy paths in the second half of the year, as the US Federal Reserve adopted a more accommodative stance compared with the European Central Bank’s relatively neutral policy position, b) heightened trade tensions, including the introduction of tariffs, which weighed on investor sentiment towards the USD and c) improved confidence in the underlying economic fundamentals of the Eurozone.
1 IMF, World Economic Outlook, January 2026
2 ECB, “Eurosystem Macroeconomic Projections”, December 2025
3 OPEC “Monthly Oil Market Report”, December 2025, January / March 2026
4 EIA, “Oil Market Report”, January 2026
Exchange rate (€/$)
FY Average 2025: 1.13 – 2024: 1.08
Exchange rate
| JAN 2024 | 1.09 |
| FEB 2024 | 1.08 |
| MAR 2024 | 1.09 |
| APR 2024 | 1.07 |
| MAY 2024 | 1.08 |
| JUN 2024 | 1.08 |
| JUL 2024 | 1.08 |
| AUG 2024 | 1.10 |
| SEP 2024 | 1.11 |
| OCT 2024 | 1.09 |
| NOV 2024 | 1.06 |
| DEC 2024 | 1.05 |
| JAN 2025 | 1.04 |
| FEB 2025 | 1.04 |
| MAR 2025 | 1.08 |
| APR 2025 | 1.12 |
| MAY 2025 | 1.13 |
| JUN 2025 | 1.15 |
| JUL 2025 | 1.17 |
| AUG 2025 | 1.16 |
| SEP 2025 | 1.17 |
| OCT 2025 | 1.16 |
| NOV 2025 | 1.16 |
| DEC 2025 | 1.17 |
*Day Ahead Market, Market Clearing Price
In 2025, the global demand for oil increased by 1.6 million barrels per day (mbpd), amounting to 105.1 mbpd.
According to estimates by the Organization of the Petroleum Exporting Countries (OPEC), global oil demand has increased by an average of 1.6 mbpd in 2025 to 105.1 million barrels per day (mbpd). In 2026, demand is projected to rise further by 1.4 mbpd to 106.5 mbpd, driven by stronger demand for transportation fuels (gasoline, diesel, jet/kerosene), continued economic expansion, and ongoing industrial and infrastructure development in non-OECD economies. Additional support is expected from rising feedstock demand in the petrochemical and chemical industries.
Across regions, oil demand in OECD countries is expected to grow by 0.15 mbpd in 2026, while demand growth in non-OECD regions, including Asia, Middle East, Africa, India and China, is anticipated to reach 1.2 mbpd. In Europe, oil demand exhibited a marginal decrease in 2025 compared to 2024, reflecting subdued private consumption, manufacturing, and construction activity.
Since early 2025, OPEC+ has begun reversing a substantial portion of its voluntary production cuts, resulting in a more sufficiently supplied global market. According to IEA estimates, global oil supply increased by approximately 3 mbpd in 2025 to around 106.2 mbpd. For 2026, supply is expected to rise by a further 2.5 mbpd, lifting total production to 108.7 mbpd, with non-OPEC+ countries accounting for 1.8 mbpd and 1.3 mbpd of the supply growth in 2025 and 2026, respectively.
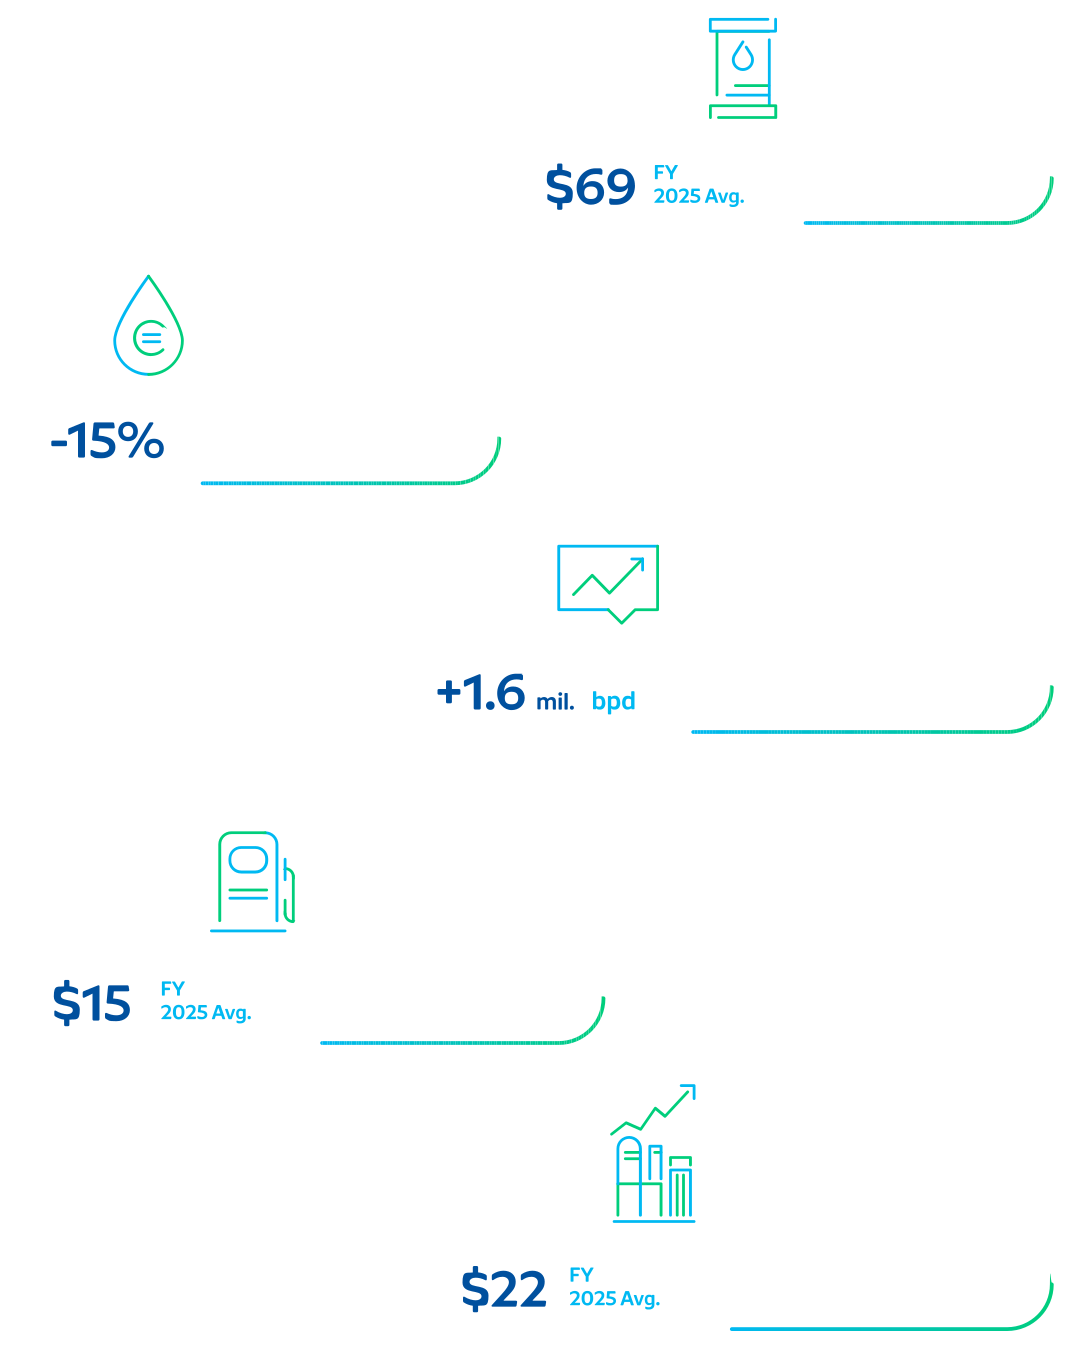
Crude oil prices declined in 2025, with Brent crude averaging $69.0/bbl, down 14.7% y-o-y, as global supply outpaced demand. Expectations of market oversupply prospects outweighed the impact of sanctions, geopolitical tensions, and elevated risk premiums, alongside record levels of strategic stockpiling by China. During the first half of 2025, crude oil prices weakened amid concerns that escalating trade tariffs among major economies could dampen economic activity and reduce global demand. In the second half of the year, announcements by OPEC+ regarding the gradual unwinding of production cuts, reinforced expectations of an oversupplied market, exerting additional downward pressure on prices.
Regarding crude oil differentials, the average spread between Brent and West Texas Intermediate (WTI) narrowed slightly to $4.2/bbl in 2025, compared with 2024.
The gradual reversal of OPEC+ production cuts, alongside strong output growth from non-OPEC+ producers, strengthened global oil supply, leading to oversupply conditions.
Brent Crude Oil Price ($/bbl)
FY Average 2025: 69.0 —2024: 80.7
Brent crude oil price
| JAN 2024 | 80.20 |
| FEB 2024 | 83.93 |
| MAR 2024 | 85.55 |
| APR 2024 | 90.00 |
| MAY 2024 | 82.01 |
| JUN 2024 | 82.61 |
| JUL 2024 | 85.31 |
| AUG 2024 | 80.91 |
| SEP 2024 | 74.33 |
| OCT 2024 | 75.66 |
| NOV 2024 | 74.47 |
| DEC 2024 | 73.87 |
| JAN 2025 | 79.03 |
| FEB 2025 | 75.16 |
| MAR 2025 | 72.60 |
| APR 2025 | 67.85 |
| MAY 2025 | 64.16 |
| JUN 2025 | 71.46 |
| JUL 2025 | 70.99 |
| AUG 2025 | 68.21 |
| SEP 2025 | 68.02 |
| OCT 2025 | 64.75 |
| NOV 2025 | 63.65 |
| DEC 2025 | 62.75 |
Brent – WTI Spread ($/bbl)
FY Average 2025: 4.2 —2024: 5.0
Brent WTI Spread
| JAN 2024 | 6.49 |
| FEB 2024 | 7.19 |
| MAR 2024 | 5.01 |
| APR 2024 | 5.61 |
| MAY 2024 | 3.43 |
| JUN 2024 | 3.77 |
| JUL 2024 | 4.68 |
| AUG 2024 | 5.48 |
| SEP 2024 | 4.76 |
| OCT 2024 | 4.10 |
| NOV 2024 | 4.97 |
| DEC 2024 | 4.16 |
| JAN 2025 | 3.96 |
| FEB 2025 | 3.97 |
| MAR 2025 | 4.66 |
| APR 2025 | 4.81 |
| MAY 2025 | 3.20 |
| JUN 2025 | 3.77 |
| JUL 2025 | 3.76 |
| AUG 2025 | 4.19 |
| SEP 2025 | 4.46 |
| OCT 2025 | 4.68 |
| NOV 2025 | 4.21 |
| DEC 2025 | 4.86 |
Benchmark Refining Margins 5
During 2025, the global refining environment benefited from tighter supply-demand balances, driven by robust growth in oil product demand and ongoing supply disruptions, which led to an improvement in benchmark refining margins. These factors became more pronounced toward year-end, as US and EU sanctions on Russian companies and imports of Russian diesel coincided with elevated refinery maintenance activity, unplanned refinery outages, and low product inventories.
The benchmark refining margins for the Med refineries increased y-o-y, as supply-demand balances have been tighter throughout the year. According to LSEG, the FCC (Fluid Catalytic Cracking) benchmark margin averaged $6.5/bbl in 2025 vs $3.8/bbl in 2024, whereas the Hydroskimming benchmark margin averaged $1.4/bbl in 2025 vs $-0.6/bbl in the respective period of last year.
5 LSEG
Med Benchmark Cracking Margin ($/bbl)
Med Benchmark Cracking
| 31/1/24 | 6,5 |
| 29/2/24 | 8,7 |
| 31/3/24 | 8,2 |
| 30/4/24 | 5,3 |
| 31/5/24 | 2,8 |
| 30/6/24 | 5,9 |
| 31/7/24 | 1,2 |
| 31/8/24 | 1,1 |
| 30/9/24 | -1,3 |
| 31/10/24 | 2,2 |
| 30/11/24 | 3,2 |
| 31/12/24 | 1,7 |
| 31/1/25 | 3,1 |
| 28/2/25 | 4,2 |
| 31/3/25 | 2,7 |
| 30/4/25 | 0,6 |
| 31/5/25 | 3,5 |
| 30/6/25 | 6,8 |
| 31/7/25 | 7,5 |
| 31/8/25 | 5,7 |
| 30/9/25 | 11,0 |
| 31/10/25 | 8,6 |
| 30/11/25 | 15,6 |
| 31/12/25 | 8,3 |
Med Benchmark Hydroskimming Margin ($/bbl)
Med Benchmark Hydroskimming
| 31/1/24 | 0,3 |
| 29/2/24 | 0,6 |
| 31/3/24 | 2,2 |
| 30/4/24 | -0,4 |
| 31/5/24 | -2,7 |
| 30/6/24 | 1,3 |
| 31/7/24 | -3,1 |
| 31/8/24 | -1,5 |
| 30/9/24 | -3,6 |
| 31/10/24 | -0,6 |
| 30/11/24 | 0,5 |
| 31/12/24 | -0,4 |
| 31/1/25 | -0,7 |
| 28/2/25 | 1,1 |
| 31/3/25 | -1,1 |
| 30/4/25 | -3,4 |
| 31/5/25 | -0,6 |
| 30/6/25 | 2,6 |
| 31/7/25 | 2,8 |
| 31/8/25 | 1,6 |
| 30/9/25 | 4,9 |
| 31/10/25 | 2,6 |
| 30/11/25 | 6,8 |
| 12/31/2025 | 0.4 |
In 2025, benchmark margins for Mediterranean refineries strengthened, reflecting tight supply–demand balances.
Oil Product Cracks 6
In relation to product crack spreads, the diesel and gasoline crack spreads increased during 2025. By contrast, the fuel oil and naphtha crack spreads decreased slightly throughout the same period. Specifically, the diesel crack spread averaged $21.8/bbl in 2025 compared to $19.0/bbl in 2024, whereas the gasoline crack spread averaged $14.6/bbl in 2025 vs $14.2/bbl in 2024. The high sulfur fuel oil (HSFO) crack spread averaged $-6.3/bbl during 2025 compared with $-10.6/bbl during 2024 and the naphtha crack spread averaged $-8.9/bbl vs $-10.8/bbl in 2024.
Naphtha ($/bbl)
Napththa
| Year | Jan | Feb | Mar | Apr | May | Jun | Jul | Aug | Sep | Oct | Nov | Dec |
| 2024 | -12.8 | -14.6 | -11.9 | -17.1 | -12.3 | -11.6 | -12.0 | -10.0 | -6.4 | -5.4 | -7.3 | -8.4 |
| 2025 | -9.5 | -5.4 | -8.3 | -9.9 | -6.3 | -11.6 | -11.8 | -8.4 | -7.8 | -8.4 | -8.2 | -10.5 |
Gasoline ($/bbl)
Gasoline
| Jan | Feb | Mar | Apr | May | Jun | Jul | Aug | Sep | Oct | Nov | Dec | |
| 2024 | 12,2 | 16,7 | 20,4 | 21,2 | 20,0 | 15,2 | 14,5 | 11,4 | 9,1 | 11,6 | 8,7 | 8,9 |
| 2025 | 9,3 | 12,1 | 9,5 | 11,1 | 16,4 | 14,6 | 13,9 | 16,3 | 19,5 | 16,3 | 21,5 | 15,2 |
Diesel ($/bbl)
Diesel
| Jan | Feb | Mar | Apr | May | Jun | Jul | Aug | Sep | Oct | Nov | Dec | |
| 2024 | 26,0 | 29,5 | 23,6 | 17,7 | 17,7 | 19,5 | 17,8 | 14,2 | 14,8 | 14,9 | 17,1 | 16,1 |
| 2025 | 16,8 | 19,5 | 15,4 | 14,4 | 16,7 | 20,0 | 26,2 | 22,1 | 26,5 | 26,3 | 35,8 | 22,7 |
*Based on Brent prices
HS Fuel Oil ($/bbl)
HSFO
| Jan | Feb | Mar | Apr | May | Jun | Jul | Aug | Sep | Oct | Nov | Dec | |
| 2024 | -17,4 | -12,7 | -13,5 | -13,5 | -10,4 | -10,3 | -8,2 | -12,6 | -11,8 | -2,5 | -6,5 | -8,3 |
| 2025 | -9,0 | -4,3 | -4,8 | -5,7 | -2,2 | -4,7 | -5,6 | -5,4 | -7,7 | -3,8 | -8,1 | -13,4 |
Natural Gas, Electricity and EUA Prices 7,8
During 2025, natural gas and electricity prices exhibited notable volatility. Specifically, the TTF Natural Gas price averaged €36.4/MWh during 2025, a 5% y-o-y increase, primarily driven by reduced Russian gas flows through Ukraine, alongside diminished levels of European inventories and stronger demand, driven by weather conditions, increased energy needs and higher EUA prices leading to increased demand for natural gas.
In Greece, with regards to electricity prices, the Day-Ahead Market Clearing Price averaged €103.8/MWh in FY25, +2.5% y-o-y. Similarly, the EUA price experienced a 13% increase, averaging €74.2/T in 2025, compared to €65.5/T in the corresponding period of the prior year.
Electricity Price (€/MWh)*
FY Average 2025: 103.8 – 2024: 100.9
Electricity
| Jan | Feb | Mar | Apr | May | Jun | Jul | Aug | Sep | Oct | Nov | Dec | |
| 2024 | 93,0 | 74,7 | 68,0 | 60,1 | 81,1 | 99,5 | 135,2 | 129,8 | 112,3 | 90,1 | 137,4 | 129,8 |
| 2025 | 135,1 | 154,1 | 105,9 | 89,1 | 81,9 | 85,4 | 100,6 | 73,2 | 92,4 | 111,1 | 108,1 | 108,3 |
TTF Natural Gas Price (€/MWh)*
FY Average 2025: 36.4 – 2024: 34.6
TTF
| Jan | Feb | Mar | Apr | May | Jun | Jul | Aug | Sep | Oct | Nov | Dec | |
| 2024 | 30,0 | 25,8 | 26,9 | 28,9 | 32,0 | 34,5 | 32,6 | 38,3 | 36,2 | 40,4 | 44,7 | 45,2 |
| 2025 | 48,4 | 50,3 | 41,8 | 35,2 | 35,3 | 36,6 | 33,9 | 32,7 | 32,3 | 31,9 | 30,8 | 27,6 |
EUA Price (€/Τ)*
FY Average 2025: 74.2 – 2024: 65.5
EUA
| Jan | Feb | Mar | Apr | May | Jun | Jul | Aug | Sep | Oct | Nov | Dec | |
| 2024 | 65,46 | 55,88 | 58,06 | 64,77 | 71,4 | 68,41 | 67,56 | 70,65 | 64,95 | 63,93 | 67,51 | 67,35 |
| 2025 | 76,58 | 75,65 | 68,62 | 64,63 | 70,38 | 72,2 | 70,62 | 71,42 | 75,82 | 78,54 | 81,13 | 84,28 |
*monthly averages
7 Bloomberg, EUA prices, January 2026
8 Electricity prices are based on the DAM MCP, which stands for Day Ahead Market, Market Clearing Price, Source: Energy Exchange Group, January 2026
Greek Market 9
According to the Bank of Greece, the Greek economy grew by 2.1% in 2025, broadly in line with its 2024 performance, despite heightened international uncertainty. Economic expansion was primarily driven by private consumption, net exports, and investment.
Private consumption benefited from favorable labor market conditions, while net exports were supported mainly by strong services exports and reduced imports. Investment also made a positive contribution, particularly in productive equipment and construction. Greece’s strong fiscal performance continued into 2025, with Bank of Greece estimates pointing to a further decline in general government debt as a share of GDP.
According to the Bank of Greece, solid economic growth, combined with fiscal overperformance and a marked reduction in the debt-to-GDP ratio, has resulted in significant upgrades to Greece’s sovereign credit ratings. The most recent upgrade was Fitch Ratings’ assignment of a ‘BBB’ rating in November 2025. Consequently, international demand for Greek government bonds has strengthened and funding spreads between Greece and its European peers have narrowed to pre-crisis levels.
The medium-term outlook for the Greek economy remains favorable. According to the Bank of Greece’s forecasts, economic growth is expected at 1.9% in 2026 and 2.0% in 2027. Consumption is expected to remain the main growth driver, while investment, supported by Recovery and Resilience Facility (RRF) funds, and exports are also projected to contribute positively.
Inflation eased marginally to 2.9% in 2025 from 3.0% in 2024, mainly reflecting increases in wages and rents. It is expected to edge up slightly to 3.1% in 2026 before declining to 2.4% in 2027, approaching the European Central Bank’s medium-term target. On the fiscal front, the general government primary surplus is projected to reach 3.2% of GDP in 2026, while public debt is projected to decline further to 137.7% of GDP.
Regarding energy consumption, preliminary official data indicates that domestic fuel demand in 2025 amounted to 6.9m MT, a 2.2% y-o-y increase. Demand for automotive fuels witnessed an increase of 1.5% (1.7% increase for diesel and 1.2% increase for gasoline), while aviation fuels consumption increased by 5.9% y-o-y.
9 Bank of Greece, Governor’s Annual Report 2025, April 2026
In 2025, the Greek economy maintained strong growth, supported by increased investment, consumption, and positive contribution from net exports.
Geopolitical Events
Geopolitical tensions persisted throughout the year 2025, predominantly centered on the protracted conflict between Russia and Ukraine, as well as various hostilities in the Middle East, notably including a twelve-day conflict between Israel and Iran during June 2025, in addition to escalating tensions between the United States (US) and Venezuela. The US and the European Union imposed new sanctions on Russia, with European authorities affirming their commitment to reducing energy dependence on Russia. Furthermore, the escalation of hostilities in the Middle East since the end of February 2026 led to significant disruptions in the global energy supply chain, with notable reduction in flows of crude oil, petroleum products and liquefied natural gas (LNG) from the region, as well as a substantial increase in international oil and gas prices.
Consequently, heightened uncertainty in international trade and increased instability have resulted in significant disruptions to critical trade routes, adversely affecting the stability of global supply chains. Moreover, a visible shift toward trade protectionism through the introduction of new tariffs and regulatory restrictions has altered the global trade landscape, rendering it increasingly fragmented. The Group diligently monitors these developments and adjusts its operations in accordance with prevailing conditions.
Geopolitical developments in 2025 maintained an elevated level of uncertainty in the international business environment.

03
Business Environment